Start with the average, then check the gust
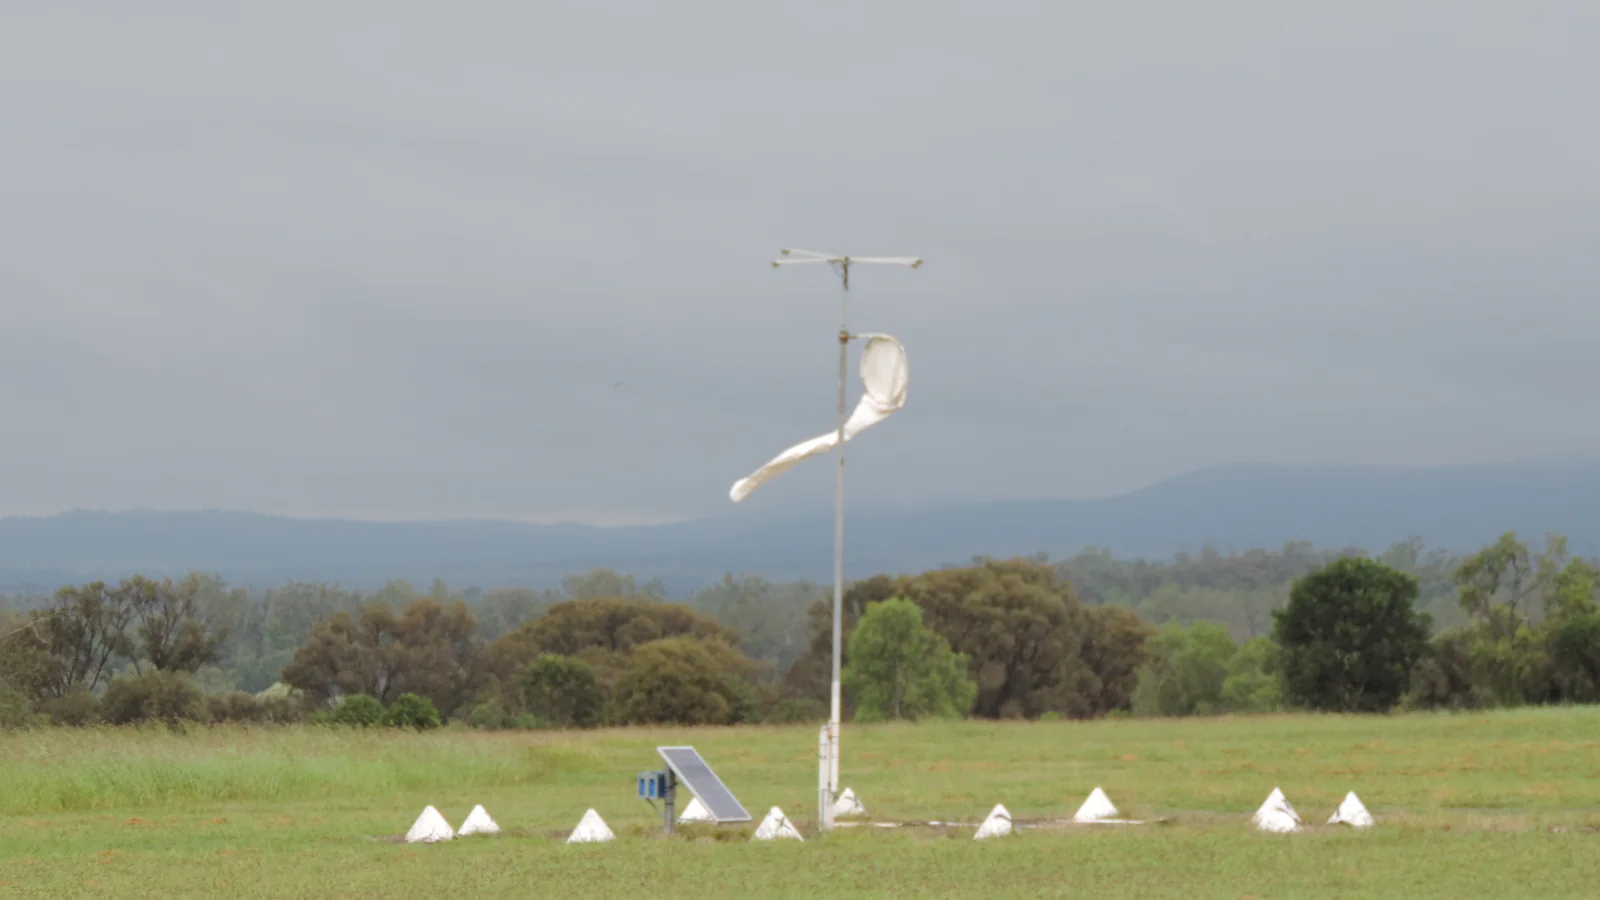
A forecast wind speed describes the expected mean flow over a defined averaging period. A gust describes a brief peak above that background. The two numbers belong together: the average tells you what conditions may feel like much of the time, while the gust shows how strong a short burst could become.
Measurement standards vary. The Met Office defines its reported mean wind as the average speed and direction over the ten minutes before the observation time. It defines a gust as the maximum three-second average within the period. The US National Weather Service glossary uses a two-minute average for sustained wind in its observing context. Always check the provider’s definition before comparing values from different services.
Why gusts matter in a city
Wind rarely flows smoothly around buildings. Corners, gaps, bridges and exposed streets can accelerate or redirect it. Trees and dense development create friction and turbulence. A forecast grid represents a wider area and cannot resolve every doorway or rooftop.
That local variability is why a modest average can coexist with an uncomfortable or damaging peak. Cyclists, high-sided vehicles, temporary structures and loose outdoor objects may respond more to gusts than to the mean speed. The duration and repetition of gusts matter too, but a simple forecast often reports only the expected maximum.
A weather station is normally placed in open exposure so nearby obstacles do not dominate the measurement. Your street may be more sheltered or more turbulent. Treat the forecast as the broad signal, then account for the route and surroundings.
Wind direction says where it comes from
Meteorological direction names the direction from which the wind is blowing. A northerly wind arrives from the north and moves toward the south. A westerly comes from the west. This convention often causes confusion when a map arrow appears to point the other way.
Direction adds context. Air arriving from sea, mountains, dry land or a dense urban area can carry different temperature and moisture characteristics. On a short city journey, direction also tells you which exposed section of a bridge or street may face a crosswind. The forecast direction can vary through the day as a front or local circulation passes.
Units can hide large differences
Wind is commonly reported in kilometres per hour, miles per hour, metres per second or knots. Compare like units. One knot equals one nautical mile per hour and is about 1.852 kilometres per hour. A number copied without its unit is incomplete.
Conversion can also create false precision. A model estimate of 30 km/h does not become more certain when displayed as 18.64 mph. Rounded values are usually more honest for public planning, especially several days ahead.
Forecast wind is not an impact guarantee
The same speed can produce different consequences depending on trees, soil moisture, building condition, elevation and exposure. Wind after heavy rain may bring down trees more easily because the soil is wet. A coastal headland and a sheltered courtyard can experience very different flow within the same forecast area.
Official wind warnings account for local practices and expected impacts. Their thresholds are not universal. Do not use a generic number from another country to decide whether local conditions are safe. Open the official service linked on the city page when strong wind could affect travel or outdoor work.
The NWS advises moving inside during high-wind warnings and taking extra care when driving, especially around high-profile vehicles. Local authorities may issue more specific instructions for a particular event.
How to read the hourly table
- Check the mean wind and maximum gust for the same hour.
- Note whether both rise together or gusts increase sharply above the mean.
- Read the direction and consider exposed parts of your route.
- Confirm the unit before comparing another forecast.
- Follow official warnings for safety-critical decisions.
A forecast with 25 km/h mean wind and 50 km/h gusts does not describe a steady 50 km/h flow. It describes a changeable period in which brief peaks may reach roughly twice the background estimate. That distinction turns two similar-looking columns into useful planning information.